

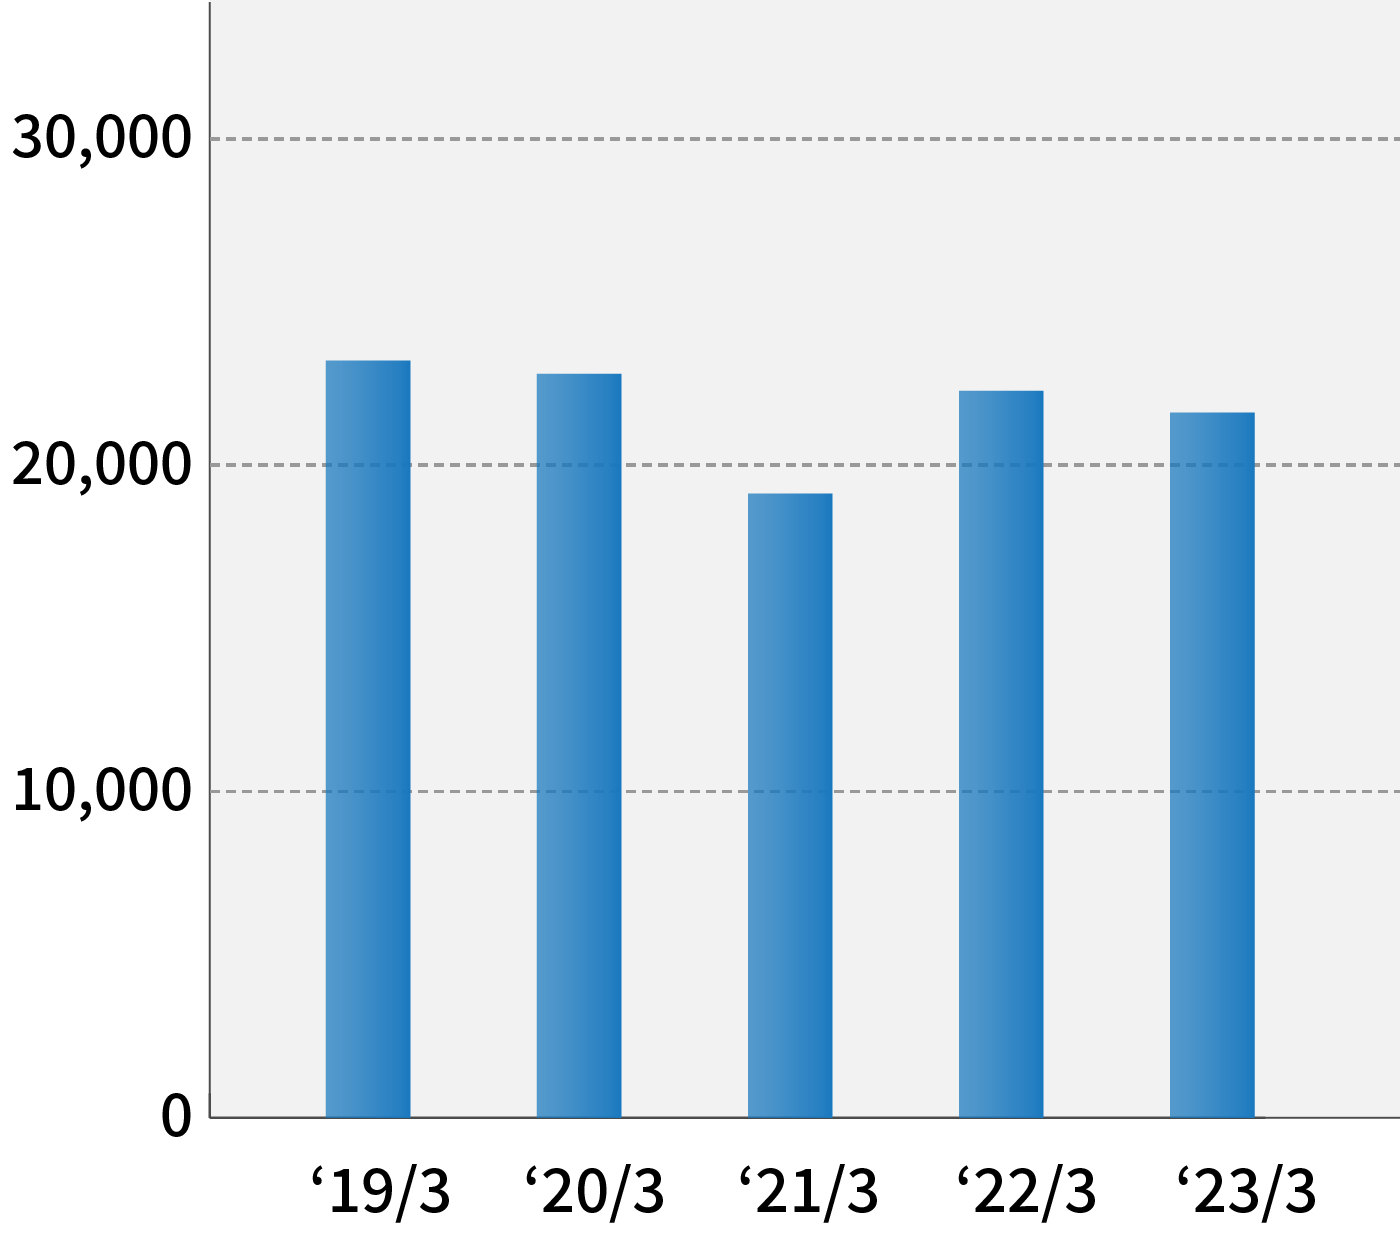
Net Sales
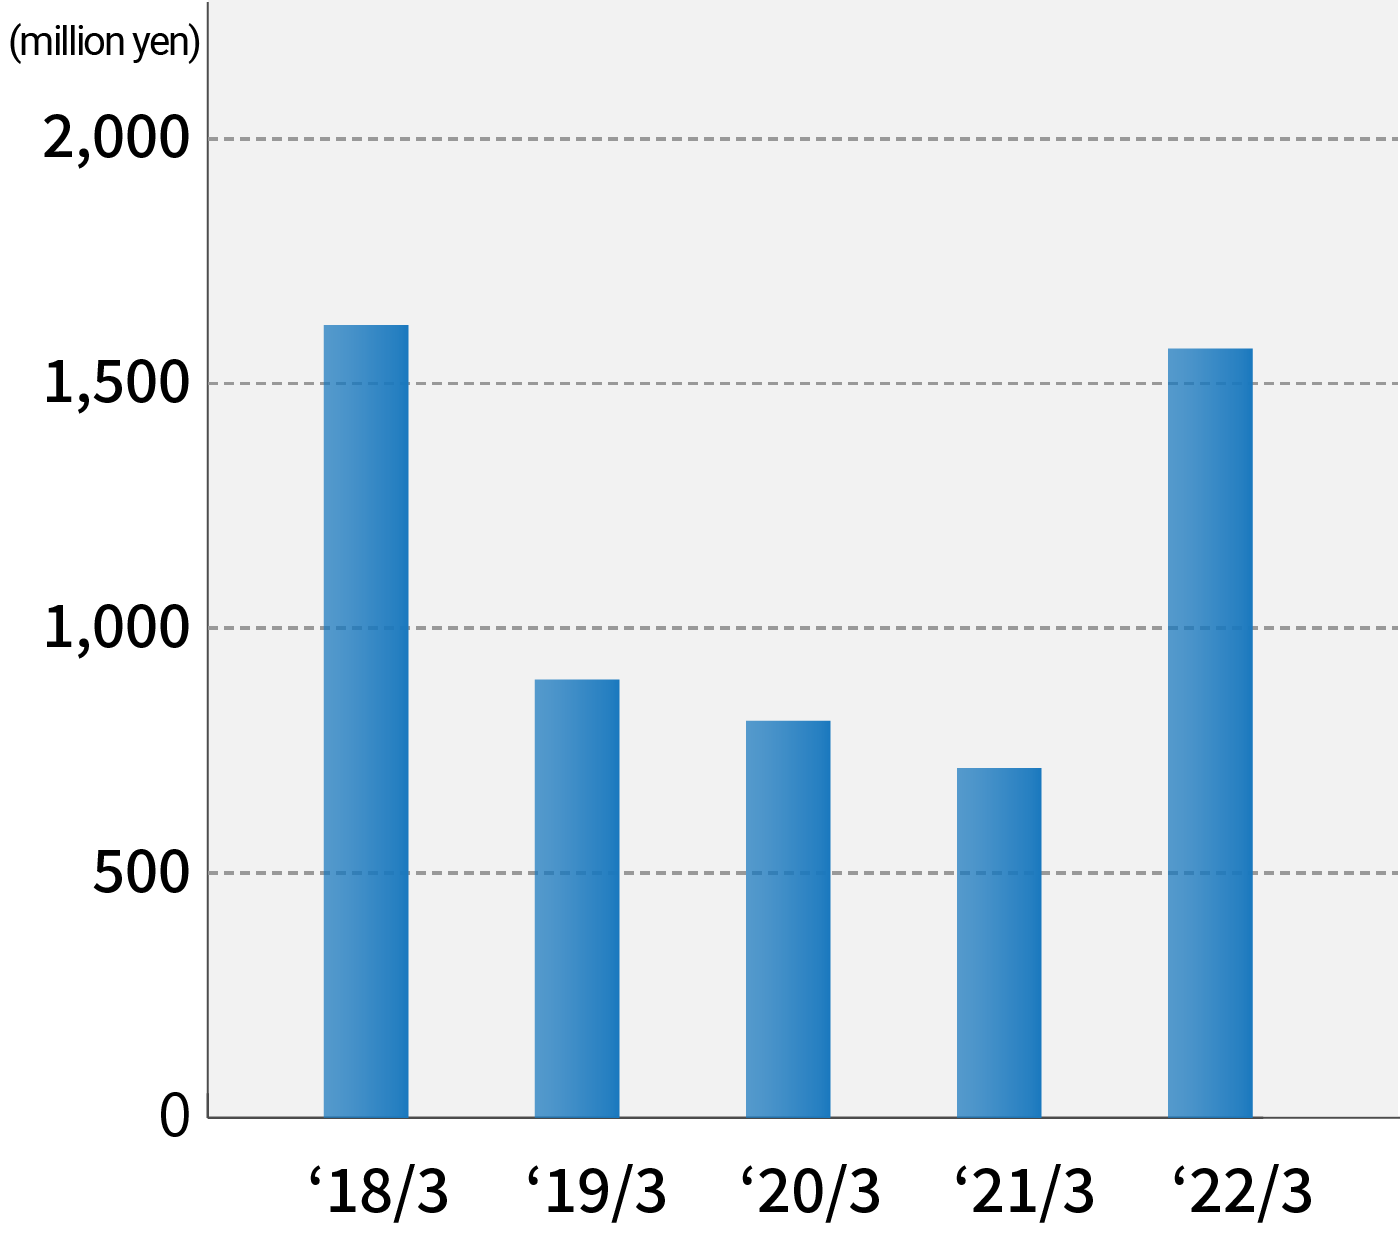
Operating Profit
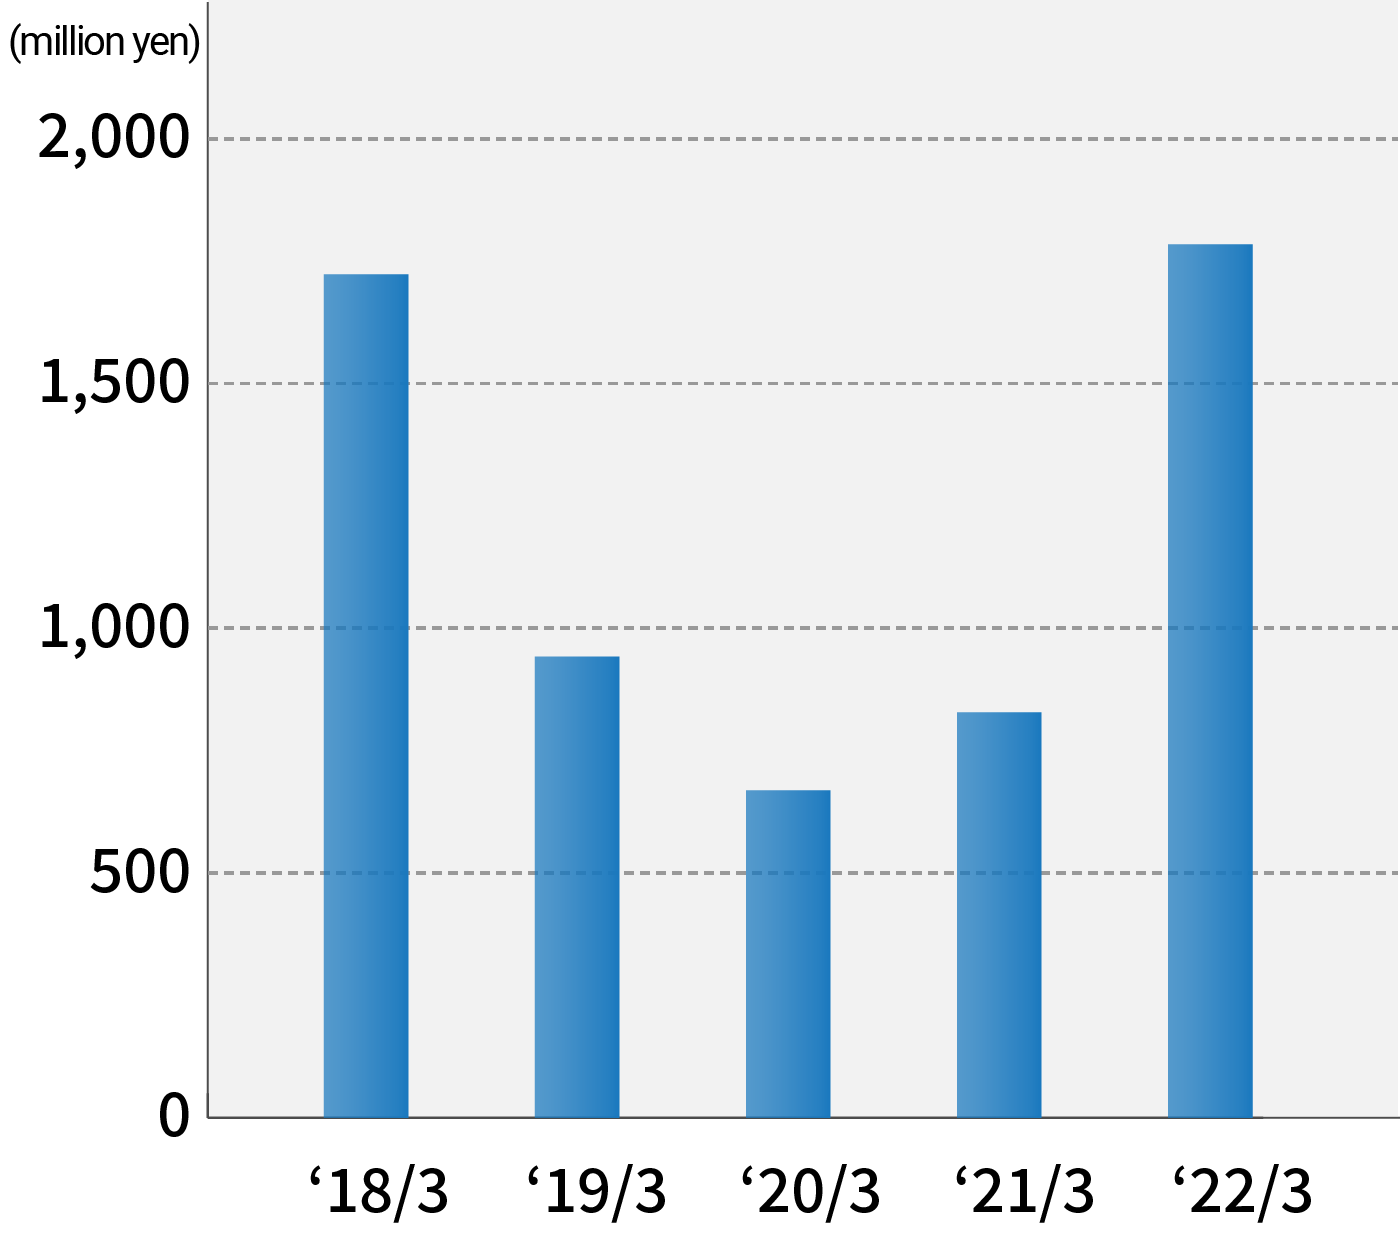
Ordinary Profit
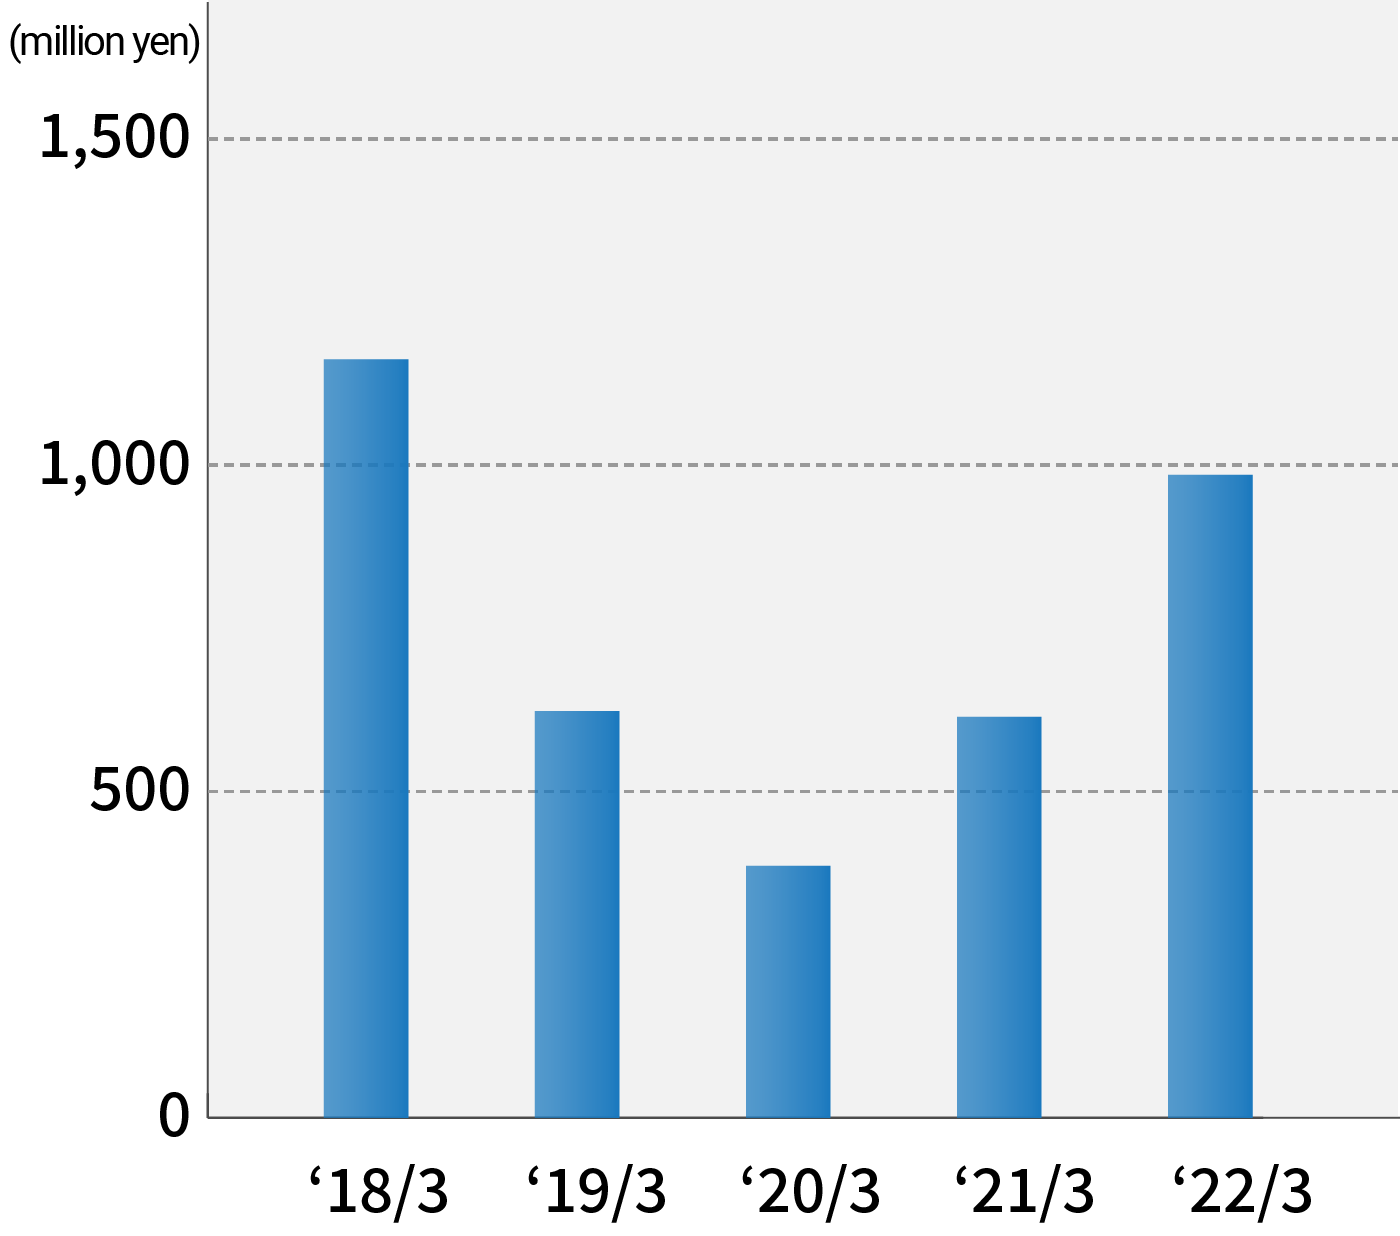
Net Income Attributable to Owners of Parent Company
Profit/Loss Status
Unit:million yen
| FY2018 | FY2019 | FY2020 | FY2021 | FY2022 | |
|---|---|---|---|---|---|
| Net Sales | 20,823 | 23,198 | 22,794 | 19,121 | 22,269 |
| Operating Profit | 1,619 | 895 | 811 | 714 | 1,571 |
| Ordinary Profit | 1,723 | 942 | 669 | 828 | 1,784 |
| Net Income Attributable to
Owners of Parent Company |
1,162 | 623 | 386 | 614 | 985 |